Origins of energy barrier accident perspective

This post will introduce the energy transfer model and the development of energy barrier accident perspective.

During 1960’s and 1970’s, two pioneering safety theories were developed, both of which studied the transition of excess energy from a source to a vulnerable target. Both theories demonstrated how accidents occurred, and paved the way for safety thinking based on potential energy sources. James. J. Gibson was the first among the two researchers to define and illustrate the energy model- Energy Source-Barrier-Vulnerable Target (as discussed in earlier post) in the year 1961  (Kjellén, 2000).

The infamous The infamous Energy Model by James. J. Gibson

However, in the 1970, William Haddon revolutionized the field of accident causation. William Haddon introduced 10 simple yet powerful rules to avoid, control, and, mitigate accidents involving vulnerable targets (Haddon, 1980).

Haddons 10 accident prevention strategies
Haddons 10 accident prevention strategies Haddon (1970, 1980)

In 1980, W.G. Johnson  defined a barrier as “The physical and procedural measures to direct energy in wanted channels and control unwanted releases”. W.G.Johnson also is famous for his proposed MORT- Management Oversight & Risk Tree adopted by the nuclear industry (read MORT manual  here).

In 1987, Urban Kjellen  used the accident prevention strategies proposed by Haddon and termed them as <Barriers> to ensuring safety, but in a later publication Kjellen proposed to use the term <Barrier> on physical countermeasure e.g. a metal mesh = <Barrier> to separate rotating propellers and vulnerable targets.  (Kjellen, 2000)

History and development of energy model into energy barrier model
History and development of energy model into energy barrier accident perspective

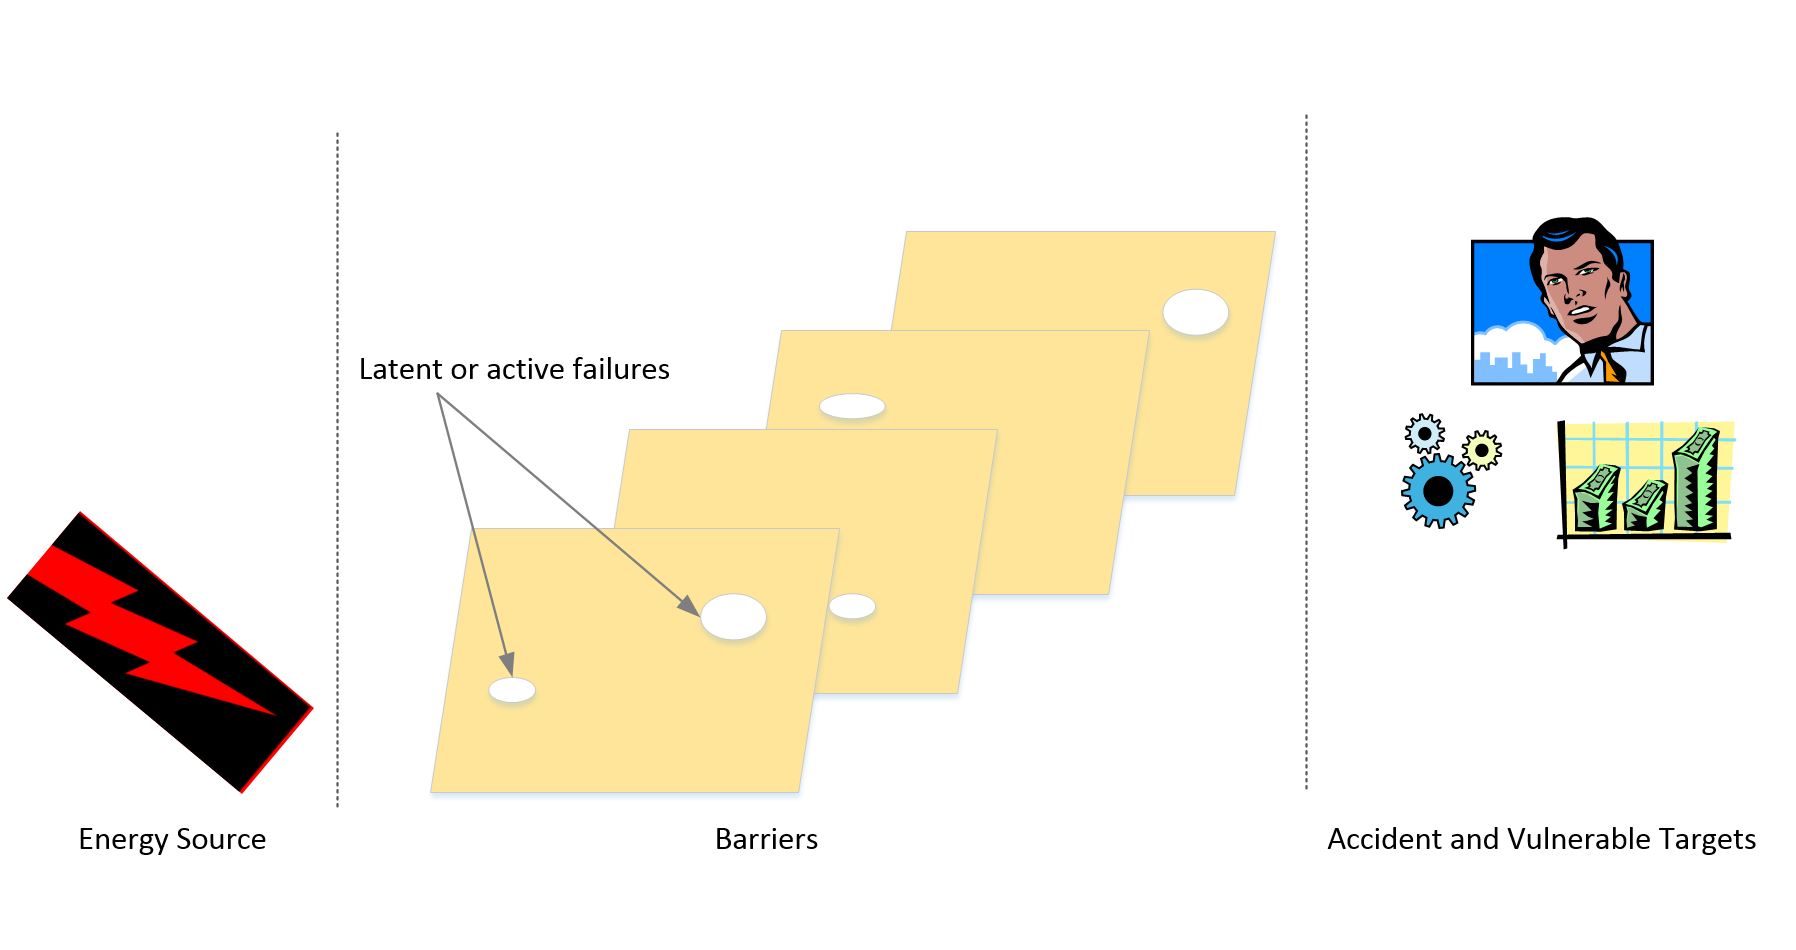
In 1997, James Reason coined a safety theory based on the notion that accidents can be avoided with a approach of defense-in-depth. In other words, there is more than one barrier in a system and every layer of the barrier, has faults and failures. Only when all of these barriers fail, will an incident or accident occur. He illustrated this in intuitive illustration of a Swiss Cheese, where the hole in the cheese illustrated failure in the barrier and rightly called the Swiss Cheese Model.  If the hazards transit through the holes in the barriers, it can convert to either a serious incident or a failure in the system. He also distinguished between terms  <latent failure> and <active failure>. Latent failure is a barrier functional failure due to unknown causes and are not observable, while active failures occur during the execution of barrier functions and are observable.

Swiss Cheese Model - James Reason (1997)
Swiss Cheese Model – James Reason (1997)

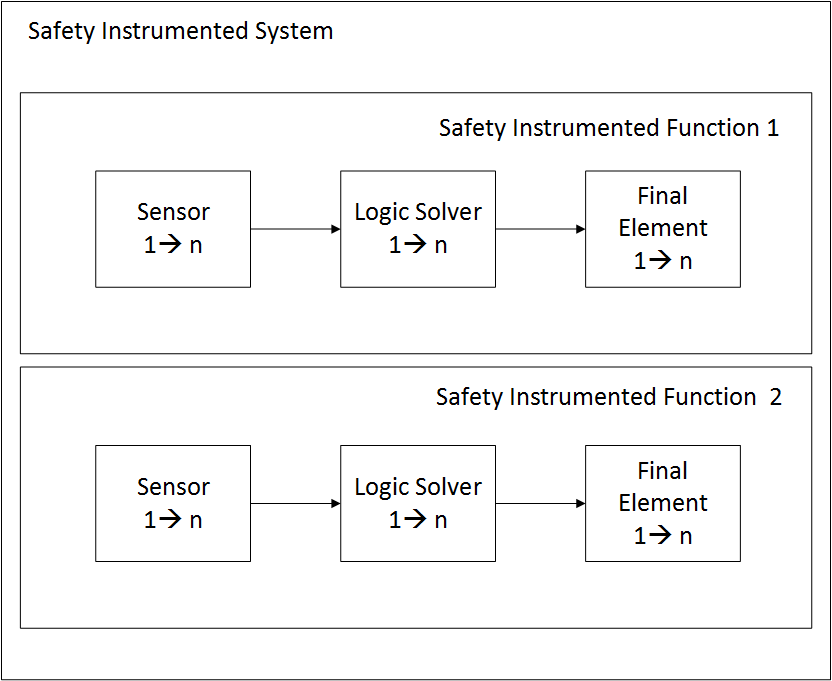
Snorre Sklet in his Doctoral thesis defined three key terms in safety and barrier performance management applicable to the oil and gas industry (Sklet, 2006). The recommendations from Sklet has been well adopted in the Norwegian Oil and gas industry. The key is to organize and use the barrier terms consistently. The recommendations were used in the recently published Petroleum Safety Authority memo on <Barrier Management>

Barrier system, functions, and elements.
Overview of barrier system, functions, and elements.
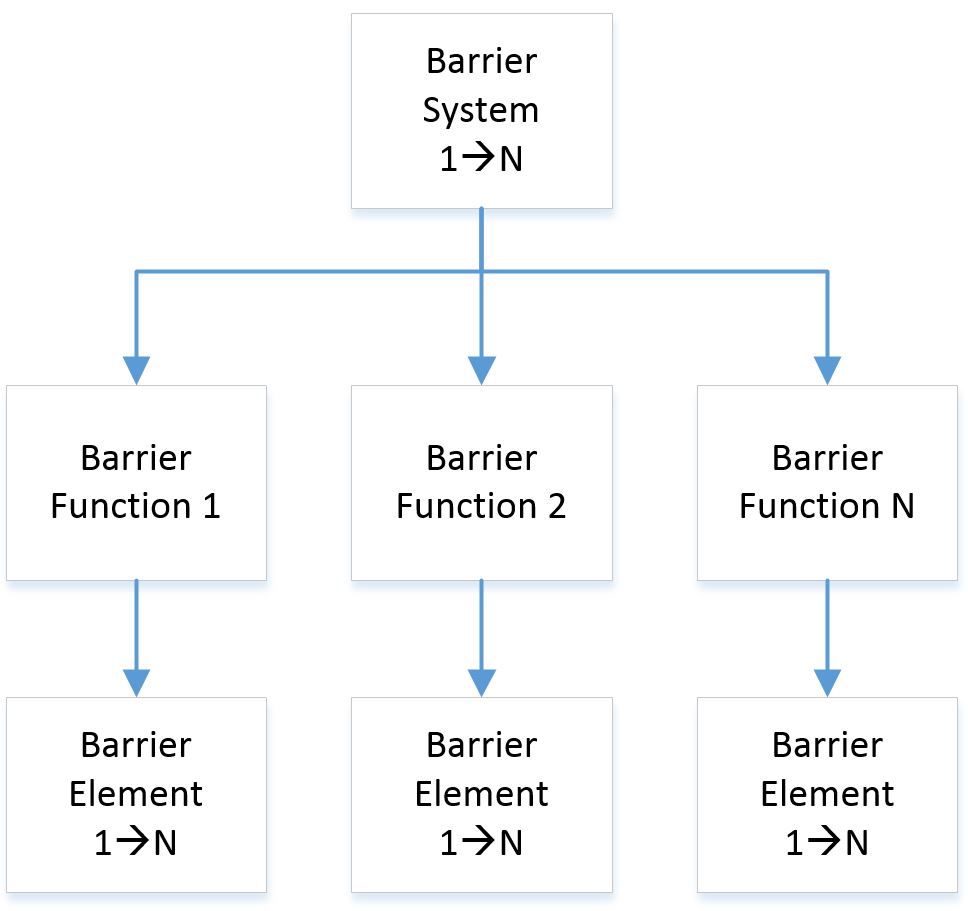
  • Barrier system– is a system that has been designed and implemented to perform one or more barrier functions. e.g, Reduce consequence of hydrocarbon leak
    • There may be one of more barrier system depending on the risk reduction requirements
  • Barrier function– is a function planned to prevent, control, or mitigate undesired events or accidents. e.g, Reduce duration and size of leak
    • Each barrier system may have 1 to N barrier functions
  • Barrier element– A barrier element is a component or a subsystem of a barrier system that by itself is not sufficient, to perform a barrier function e.g, Process shutdown systems
    • Each barrier function requires 1 to N number of barrier elements to function on demand

In 2013, Petroleum Safety Authority (PSA) published the barrier management principle memo to guide oil and gas operators in maintaining barrier management according to the PSA requirements. This guide builds on previous work on RNNP (Trends in Risk Level  in petroleum industry)  and suggests development of technical, operational and organizational safety barriers.

So, how is energy barrier accident perspective applied in high risk industries?

Lets consider a typical bow-tie risk model. The left of side of the bow-tie contain preventive barrier systems, functions, and elements (before the accident). The same is true to the consequence part (right) of the bow-tie (after the accident) . As illustrated, the energy source initially has to transit through the preventive barriers before the accidental event can occur. The number of barrier systems may differ depending on the overall hazard identification and corresponding risk reduction strategies for a given system.

Energy barrier perspective with a bow-tie risk model

If the accidental event occurs, the barriers to prevent escalation of the event have to perform as planned. If they don’t, the vulnerable target, be it human, machinery or cost of operations are severely affected.  In a traditional barrier management approach, the energy can be ideally traced to the source, in ideal situations (with help of risk management and reliability assessment). A key point to note here is that these barriers are not only technical barriers, e.g, valves. Barriers may also be in form of operational procedures, or organizational practices. In other words, Man Technology and Organizational barriers (MTO) have to be combined.

A case study

Let us take the Macando blowout as an example to demonstrate the energy barrier accident perspective. Previous studies have shown that the cause of the blowout are not due to a single failure, but a set of multiple failures in the MTO barriers. The illustration shows the barrier functions and barrier elements in green blue and yellow boxes. The barrier system – avoid hydrocarbon leak.

Macando blowout explained with energy barrier accident perspective

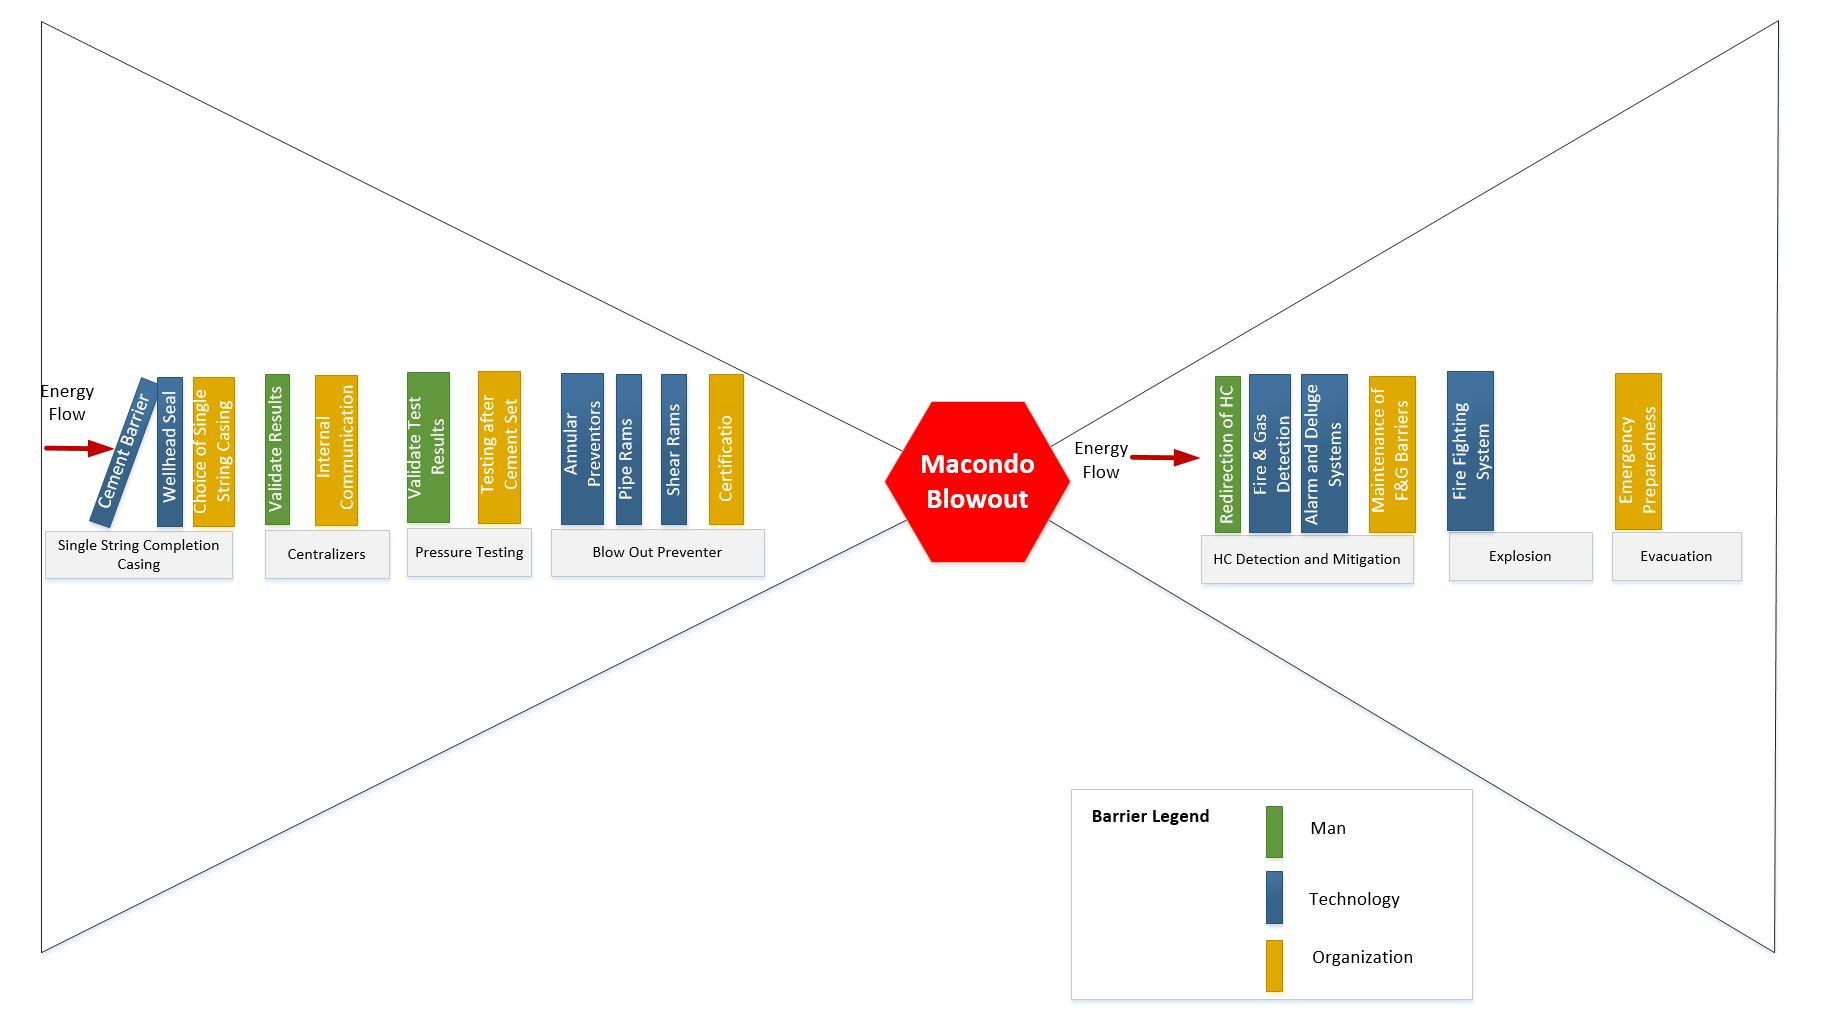
One observation, as it is pointed out in the limitations section is that, the illustration shows the accident progression to be linear, but seldom do complex system fail with single failures. This example shows the main draw back of the energy barrier accident perspective; linear vs. complex system interactions.

Strengths of the energy barrier accident perspective

  • Useful tool to identify hazard control strategies
  • Forms a basis for analytical risk control
  • Fundamentally based on energy transfer phenomenon and physics of the immediate environment
  • Helps avoid over conservative design of barrier functions. Choice of right preventive defense strategies.
  • Is transferable within various application fields, such as medicine, emergency preparedness, and high risk industries.
  • For example, a computer virus may be termed as a potential energy transiting through a network of computer servers.

Limitations of the energy barrier accident perspective

  • Energy model and energy barrier perspectives are fundamentally based on linear progression of failures to an accident, while accidents may occur due to complex interactions in a complex system.
  • Inter-dependencies between barriers from different barrier systems exist and may be missed during various safety analysis. E.g., Failure of power supply may effect one or more sub-barrier functions.
  • The adoption of energy transfer model in a large-scale system may deem challenging due to need for system co-ordination in distributed systems, e.g., Aviation industry.
  • If over conservative barrier functions are designed, it may complicate the workings of the entire system and increase the inter-dependencies .


Feel free to explore the following references.


References

Johnson, W.G (1980). MORT Safety Assurance Systems. New York: Marcel Dekker http://tinyurl.com/qf98bdn

Haddon, W. (1970). On the escape of tigers: An ecological note. Technological review, 72(7), Massachusetts Institute of Technology, May 1970.

Haddon, W. (1980). The Basic Strategies for Reducing Damage from Hazards of All Kinds. Hazard prevention, Sept/Oct. 1980.

Kim, Hyung Ju. (2014) Titanic Viewed from Different Perspectives on Major Accidents. Presentation TPK5160 Risk Analysis- URL: http://frigg.ivt.ntnu.no/ross/risk/slides/kim-06-14.pdf

Kjellen, U. 2000: Prevention of Accidents Through Experience Feedback, Taylor & Francis, London and New York URL: http://tinyurl.com/nwbl9er

Petroleum Safety Authority. 2013. Principles for barrier management in the petroleum industry. Technical report. URL : http://www.ptil.no/getfile.php/PDF/Barrierenotatet%202013%20engelsk%20april.pdf

Rosness, R., Grøtan, T. O., Guttormsen, G., Herrera, I. A., Steiro, T., Størseth, F., Tinmannsvik, R. K., and Wærø, I., 2010, “Organisational Accidents and Resilient Organisations: Six Perspectives Revision 2,” No. Sintef A 17034, SINTEF Technology and Society Trondheim. URL:  http://tinyurl.com/pf4sbbb

Reason, J. 1997: Managing the Risks of Organizational Accidents. Ashgate. http://tinyurl.com/nodbbov

Sklet, S. 2006. Safety barriers on oil and gas platforms. means to prevent hydrocarbon releases. Doctoral thesis. http://www.diva-portal.org/smash/get/diva2:122483/FULLTEXT01.pdf

Subsea safety valves – types, safe-states, and function.

Extraction of oil and gas from deep offshore reservoirs is a risky business and can result in serious accidents, such as the recent Macando Blowout. Functional safety along with proper operations and maintenance procedures play a vital role in ensuring safe subsea oil and gas production. In this post, types of subsea valves, their safe-states and their function is described. Towards the end, an illustration of remote activation of subsea safety valve is also provided.

In functional safety terminology, a safety valve is the final element of a safety instrumented function – SIF, which acts as a physical barrier to the flow of hydrocarbons, chemicals, etc. A safety instrumented system (SIS) may contain one or more number of safety instrumented functions. Each safety instrumented function may further contain one or more final elements. A typical relation between SIS and SIF is illustrated in Figure 1.

Safety Instrumented System and Safety Instrumented Function
Figure 1 Safety Instrumented System and Safety Instrumented Function

Function of subsea safety valves

Isolate or contribute to isolate the flow of hydrocarbons and other production fluids between a pre-determined zone.


 Before describing the overall architecture of subsea safety valve control, some basic facts about safety valves are listed below.

  • Safety valves (final elements) are part of a safety instrumented system (Sensor – Logic Solver – Final Element)
  • Operated vastly by electrohydraulic configurations. (Some are also operated pneumatically topside and some with flow pressure changes)
  • Vary greatly in size and design aspects. (Gate, ball, shear types etc.)
  • The Subsea Control Module receives electrohydraulic supply from the topside offshore facility.
  • The Subsea Control Module controls the electrohydraulic supply to the subsea valves (both directional control valves and external safety valves)
  • System safety engineers evaluate the SIS and the SIF architectures according to standard and system requirements.

 Subsea control systems

Basically, there are two different types of subsea control systems. Firstly, a basic control system (process control), which is used to control normal operations of the subsea production system and secondly, a safety control system (Safety Instrumented System), which is used to control abnormal incidents and avoid accidents by isolating the energy source.

drawing1
Figure 2 Subsea safety control high-level architecture (multiplexed architecture)

Figure 2 illustrates the overall high level safety architecture for a subsea production system.

Subsea safety valves

Key safety related valves in the subsea industry are as illustrated in Figure 3.

Different Subsea safety valves
Figure 3 Different Subsea safety valves
  • Directional control valves: These are electrohydraulic/electropneumatic valves, which can direct the hydraulic fluid flow from one port to another port when the function requires such an activation. Some are external directional control valves; i.e, they are hydraulically operated through another DCV housed in the subsea control module. Multiplexing of valves are carried out to ensure limited amount of hydraulic fluid to operate a valve and to design sequential shutdowns.
HCV151.11.11.12-3.2-feature-image1
Directional Control Valve (Credits- Oceaneering)
  • Gate valves: These valves can vary in size depending on the diameter of the production bore or annulus bore. They can be double acting or spring actuated gate valves. If  the valve actuator requires pressure to either open and close the valve, then such type of valve is called double acting valve. On the contrary, spring actuated gate valves need hydraulic power to either open or close the valve. The spring chamber acts as a potential energy source to assist in close or open function of the valve, thereby decreasing the value closure/opening time.
HydraulicGateValve
Hydraulic Operated Subsea Gate Vavle (Credits- Olovervalvetek)
  • Shear rams: These are special type of valves, mainly used to cut and seal the production and annulus bore. They are one of the most critical valves in the safety function. The shearing function allows the riser to be disconnected from the topside facility. They are used as a last resort safety function, i.e, when isolation of hydrocarbons fail. One of the root technical causes for the Macando Blowout was multiple failure in Shear rams (DHSG, 2011).
Shear Ram
Shear Ram (Credits – New York Times)
  • Shuttle valves: The shuttle valve can allow flow of fluid from one of the two valve output ports. The pressure of the supply fluid determines which output port can function at any given time.
subsea_shuttle_valve
Subsea Shuttle Valve (Credits- Bifold)
  • Check valves: The function of a check valve is to ensure that it allows flow of fluid to the output port provided the flow pressure is higher than it’s trip pressure. When used in opposite configuration, a check valve can only allow flow from one direction and block the flow in the other direction. Usually check valves are used as exhaust valves and in some cases to avoid hydraulic pressure loss from a hydraulic circuit (avoiding hydraulic back flow).
Subsea Check Valve (Creidts – Olivervalvetek)

Safe states of safety valves

Safe state is defined as “state of the equipment under control when safety is achieved” (IEC 61508). The safety function dictates the configuration of the valve safe state. For example, let us assume safe state for a valve is  “close”. When a safety function is triggered, the valve should close, if not, the system is said to be in a failed state (valve still open). In the contrary, if the valve safe state was “open”, the safe state would be achieved only if the valve remained open or shifted to open position from a closed position. The configuration of the safe state therefore directly depends on the system safety requirements, which is most important to be considered while designing a safety function. Some process need to be isolated to be safe (production gate valves), while others need to be relieved to be safe (pressure relief valves).

Fail states of safety valves
Figure 4 Fail states of safety valves

In subsea safety valves, there are mainly four different safe states depending on the type of configuration of the system and type of valve. For example, a gate valve may be configured to fail safe close, fail safe open, or fail as is safe states. A shear ram in the contrary has a safe state of shear and seal.  One thing common among all the safe states of a safety valve are the external power sources required to perform the function: hydraulic, electrically, and/or  pneumatic.

Example – Activation of a subsea safety valve

Now, let us take an example of a SIF, which consists of a gate valve as the final element. In figure 5, the illustration to the left shows the valve to be in the open position. For this example, let us assume that the safe state for the gate valve is to isolate hydrocarbon flow and the valve is configured as a “fail safe close” type.

Normal Working Condition

During normal working condition the electrohydraulic supply is provided from the topside facility to the Subsea Control Module (SCM). In the SCM, a directional control valve is energized electrically with help of a subsea logic solver. This electrical power ensures the hydraulic fluid flow to the hydraulic open chamber of the safety valve is continuous. A subsea accumulator in the SCM provides the hydraulic supply to the two valves. The hydraulic pressure in the open chamber of the valve acts against the spring chamber to keep the valve in open position. The return line in the direction control valve is blocked due to directional control valve’s inherent design (flow in one direction).

Figure 4 Example of a safety loop and valve safe state
Figure 5 Example of a safety loop and valve safe state
Safety Response

During a safety response, the subsea logic solvers execute the safety function by cutting the power to the directional control valve. The hydraulic flow ports shift due to loss in electrical power in the directional control valve. The hydraulic fluid in the hydraulic open chamber of the valve is returned to the exit port of the directional control valve. Simultaneously, the spring chamber exerts additional pressure stored in the form of a potential energy in the spring and decreases the time required for the gate valve to close. The return hydraulic fluid is either exhausted to the sea or routed to a subsea compensatory (fluid return storage).


References

Bai, Yong, and Qiang Bai. 2012. Subsea Engineering Handbook. Burlington: Elsevier Science.

IEC 61508. Functional safety of electrical/electronic/programmable electronic safety-related systems, 1998. Part 1-7.

IEC 61511. Functional safety – safety instrumented systems for the process industry sector, 2003.

Marvin Rausand. Risk Assessment : Theory, Methods, and Applications. John Wiley & Sons, Inc, 2011.

OLF 070. Guidelines for the application of IEC 61508 and IEC 61511 in the petroleum activities on the continental shelf, 2004.

The Deepwater Horizon Study Group 2011. Final report on the investigation of the Macondo well Blowout.

Blog post header image is credited to Oceaneering. http://www.oceaneering.com/

Analysis and Discussion of Deepwater Horizon Accident and Barrier Strategies

The Macando well blowout in the Gulf of Mexico has been one of the most comprehensively studied accidents in the oil and gas industry, which resulted in numerous accident investigation reports. The report attached in this post, analyzes the Macondo blowout and the barrier strategy that was in place when the accident occurred.  “Final report on the investigation of the Macondo well blowout” by The Deepwater Horizon Study Group (DHSG) was extensively referred during this study. The overall goal was to discusses what could have been done differently in order to minimize the escalation of the outcome/consequences or even interrupt the chain of events that caused the blowout.

Emergency rescue attempts of Deepwater Horizon Rig- April 20, 2010 (Credits- SkyTruth- Flickr)

The report employs the human risk perspective, meaning more than 80 days of oil spill after the sinking of the rig  and the corresponding environmental damage caused were outside the scope of this study. We choose to limit the analysis of the accident up to the rescue of personnel not because the 5 million barrels of oil (Vinnem 2014, DHSG 2011, CSB 2014) reportedly split is of small importance, but to keep this study within a feasible analysis scope.

Contributions

  • A condensed presentation of the failed barriers and accidental events are illustrated chronologically through a STEP Diagram.
  • Failed barriers are analyzed with  Energy Flow  and Man, Technology, and Organization (MTO)  perspective.
  • Both analysis further evolves to include human and organizational aspects relevant to failures that permitted the accident to escalate to the point where 11 deaths and 17 injuries occurred.
  • A comparison of other similar accidents in terms of causes and consequences are described.
  • Based on PTIL’s 2013 Barrier Management Memo, the report proposes specified barrier strategy based on the failure of barrier functions revealed during the accident.
  • Suitable performance standards to measure the performance of recommended barrier strategies.

Main conclusions 

  • Complex systems will continue to manifest complex accident propagation.
  • Risk analysis must be performed and updated during the life-cycle of the facility to decrease dormant and weak MTO barriers.
  • Barrier management is paramount because the organizational and human barriers are constantly in demand during accident progression.
  • Human and organizational barriers (passive/active barriers) are comparatively more vital than the technical barriers, which are for the most part active barriers. This claim is supported by the findings by the MTO analysis.
  • Systems safety should not be neglected in favor of traditional HSE indicators.

Access to full report:  Report

Access to presentation: Presentation

Acknowledgment

I would like to thank Nathalie M. De Oliveira, the co-author if this report and presentation for her valuable contributions.

References

[Vinnem, 2014] Vinnem, J. E. (2014). Offshore Risk Assessment Vol 1 and 2, volume 1 and 2. Springer London, 3rd edition edition.

[The Deepwater Horizon Study Group (DHSG), 2011] The Deepwater Horizon Study Group (DHSG) (2011). Final report on the investigation of the macondo well blowout. Technical report, Center for Catastrophic Risk Management (CCRM).

[CSB, 2014] CSB, U. (2014). Deepwater Horizon Blowout Animation. YouTube Video https://www.youtube.com/watch?v=FCVCOWejlag

[PSA, 2013] PSA, P. (2013). Principles for barrier management in the petroleum industry. Technical report.

[Rausand, 2005] Rausand, M. (2005). Lecture Notes- Risk Assessment- Preliminary Hazard Analysis (PHA).

[Rausand, 2011] Rausand, M. (2011). Risk Assessment : Theory, Methods, and Applications. JohnWiley & Sons, Inc.

[Sklet, 2006] Sklet, S. (2006). Safety barriers on oil and gas platforms. means to prevent hydrocarbon releases.

[PSA, 2014] Petroleum Safety Authority Norway- PSA (2014). PSA regulations. http://www.psa.no/regulations/category216.html